
New Jersey Storm Alerts
Active National Weather Service hail, wind, thunderstorm, tornado, tropical and winter storm alerts covering New Jersey, with the counties each one names and the office that issued it — plus what the state’s severe-weather season looks like and how each of these events actually damages a roof.
Below that, in its own lane, the smoke and fire family: fire weather, dense smoke, air quality, blowing dust and volcanic ashfall.
0 active alerts · read from the National Weather Service at Oct 10, 7:44 AM EDT · refreshed every 10 minutes
This page is informational and is not a safety resource. It exists to show roofing professionals where storm damage has been reported, and it is refreshed on a ten-minute cycle, so it can lag the Weather Service.
During an active weather event, the authority is weather.gov and your local emergency management agency. Follow them, not this page.
Active storm alerts in New Jersey
Reproduced exactly as the National Weather Service issued them. Alerts frequently cross state lines, so a county list may name counties in a neighbouring state. Smoke and fire alerts are reported separately, in their own lane below.
No active alerts
The National Weather Service has no active hail, wind, thunderstorm, tornado, tropical or winter storm alerts covering New Jersey as of this refresh. This is the normal state most days, and this page fills itself the moment NWS issues something.
Radar over New Jersey
Straight from radar.weather.gov and regenerated by NOAA roughly every two minutes.
NWS radar — the Northeast
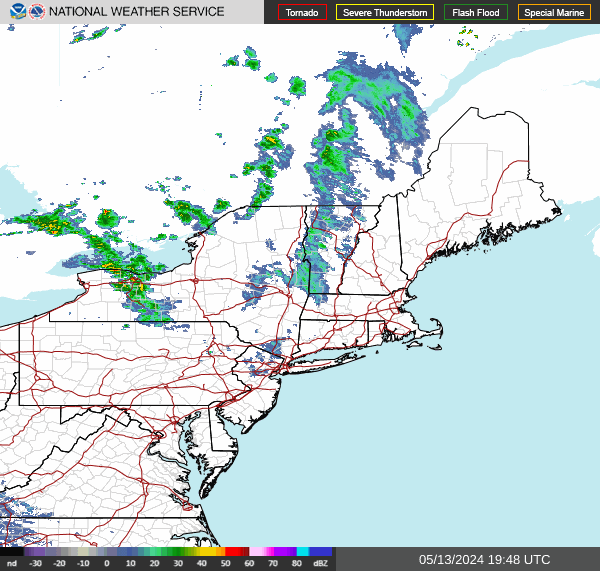
Where precipitation is falling over New Jersey right now. The National Weather Service publishes these mosaics by region rather than by state, so the frame runs past the state line and neighbouring states are visible in it. Radar shows precipitation, not damage — a return over a county is not evidence that any particular building was hit.
Radar imagery: the National Weather Service. Served directly from radar.weather.gov, a free US Government service, and regenerated by NOAA roughly every two minutes — your browser picks up new frames on its own. This site does not process, re-colour or re-time the imagery; it is the Weather Service’s own mosaic, unmodified. weather.gov
This radar is informational and is not a safety resource. During an active weather event, the authority is weather.gov and your local emergency management agency. Follow them, not this page.
Smoke & fire lane
Smoke & fire alerts in New Jersey
The National Weather Service issues a separate family of alerts for fire weather, dense smoke, air quality, blowing dust and volcanic ashfall. This lane reports that family for New Jersey, kept apart from the storm alerts above because the two answer different questions.
Wildfire smoke is what drives smoke-damage losses, and it reaches a building through the same vents that keep an attic dry — which is why it belongs on a roofing page at all. Alerts describing particulate already in the air are listed ahead of fire-weather forecasts; that ordering is this lane’s own and is not a Weather Service ranking.
0 active smoke or fire alerts · read from the National Weather Service at Oct 10, 7:44 AM EDT · refreshed every 10 minutes
No active smoke or fire alerts
The National Weather Service has no active fire weather, dense smoke, air quality, blowing dust or volcanic ashfall alerts covering New Jersey as of this refresh.
An empty list here is the ordinary reading, not a fault and not a gap in the data. Most of the country carries nothing in this family on most days, and this lane fills itself the moment the Weather Service issues something.
The 12 alert types this lane reports
Every one is a National Weather Service product and is listed under the name the Weather Service gives it. Grouping them into families is ours; the names are not.
- Fire weather
- Fire WarningExtreme Fire DangerRed Flag WarningFire Weather Watch
- Dense smoke
- Dense Smoke Advisory
- Air quality
- Air Quality Alert
- Blowing dust
- Blowing Dust WarningDust Storm WarningBlowing Dust AdvisoryDust Advisory
- Volcanic ashfall
- Ashfall WarningAshfall Advisory
The Weather Service defines each of these products and this site does not attempt to. What any one of them means, and the criteria an office issues it under, are at weather.gov.
This lane is informational and is not a safety resource. It reports which National Weather Service smoke and fire alerts are active and where, on a ten-minute refresh cycle, so it can lag the Weather Service.
During an active weather event, the authority is weather.gov and your local emergency management agency. Follow them, not this page.
Smoke exposure and air quality are health matters, and this page does not address them. It does not tell you whether it is safe to be outdoors or to work, what an air quality index number means for you or for anyone in your household, or what respiratory protection to use. Those questions belong with a clinician and with the agency that issued the alert. The federal air-quality authority is airnow.gov.
What smoke does to a roof assembly
An active alert is a record of conditions, not a finding about any building. These are the standing references on the building-assembly side of a smoke or fire loss.
Severe weather season in New Jersey
Peak season
June–October for tropical and convective, December–March for winter
New Jersey’s coast puts it in the track of tropical and post-tropical systems during the Atlantic hurricane season, June 1 to November 30, where the roofing mechanism is hours of sustained wind combined with wind-driven rain. Winter nor’easters bring the same coastal wind with wet snow and ice instead. Summer thunderstorm wind is the most frequent event of the three.
Seasons describe a pattern, not a schedule. The National Weather Service issues these products year-round, and the live list above is the only authority on what is actually running in New Jersey right now.
What NOAA has recorded in New Jersey
The archived record, not the live feed. Severe weather logged by the National Centers for Environmental Information over the covered years, split into the events NOAA keys to a county and the events it keys to a forecast zone.
Between 2016 and 2026, NOAA recorded 3,276 county-level severe-weather events across New Jersey: 2,865 thunderstorm wind events, 356 hail reports and 55 tornadoes. Of the 356 hail reports carrying a measured size, 215 were 1.00 in across or larger.
A further 898 events over the same period were recorded against National Weather Service forecast zones rather than counties — 362 winter storms, 325 high wind events, 71 strong wind events, 55 heavy snow events and 47 blizzards. A forecast zone is not a county: it can span several or subdivide one, so these are reported here at state level and appear in no county total on this site.
County-keyed events
3,276
2016–2026
Zone-keyed events
898
statewide, not county-attributable
Hail 1.00 in or larger
215
of 356 sized hail reports
Tornadoes
55
in the county record
Counties with the heaviest record
Ranked by the number of county-keyed events NOAA recorded, 2016–2026. 21 of New Jersey’s counties carry a record in this dataset.
- Burlington County462largest hail 2.50 in (Baseball) · peak gust 68 kt (about 78 mph)
- Monmouth County280largest hail 1.75 in (Golf Ball) · peak gust 85 kt (about 98 mph)
- Ocean County250largest hail 1.75 in (Golf Ball) · peak gust 81 kt (about 93 mph)
- Camden County248largest hail 2.50 in (Baseball) · peak gust 70 kt (about 81 mph)
- Morris County224largest hail 1.50 in (Ping Pong Ball) · peak gust 61 kt (about 70 mph)
- Somerset County194largest hail 1.00 in (Quarter - Half Dollar) · peak gust 74 kt (about 85 mph)
- Hunterdon County179largest hail 1.50 in (Ping Pong Ball) · peak gust 74 kt (about 85 mph)
- Middlesex County179largest hail 1.75 in (Golf Ball) · peak gust 65 kt (about 75 mph)
Preliminary — not yet in the permanent archive
259 further preliminary storm reports have been filed against New Jersey counties since June 1, 2026. They are counted separately from every archived figure above and are not added to any of them.
Preliminary reports covering 2026-05-31 onward come from National Weather Service storm reports filed as events occur. They have not yet been through the quality-control review that produces the permanent archive, and individual reports may later be revised, combined or withdrawn.
County figures and state figures. County figures count events NOAA recorded against a county (hail, thunderstorm wind and tornadoes). High wind, winter storms, ice storms, blizzards, heavy snow, hurricanes and tropical storms are recorded against National Weather Service forecast zones rather than counties, so they are reported at state level instead. Counts reflect events that were observed and reported.
Source. Archived figures come from the NOAA National Centers for Environmental Information Storm Events Database, covering 2016 through May 31, 2026. Reports after that date come from NOAA Storm Prediction Center preliminary storm reports. Both are US Government works in the public domain. This is a record of past weather; the live alert list at the top of this page is the only authority on what is running in New Jersey now.
What these storms do to a roof
The damage mechanisms that matter in New Jersey, in the order they generate work here.
Straight-line wind
Wind damage on a shingle roof usually starts as a broken seal rather than a missing shingle. Uplift pressure is highest at the edges — rakes, eaves, ridges and hips — and along any line where the roof plane changes, so that is where tabs lift and the factory sealant strip lets go first. Once the seal is broken, a shingle that still looks fine from the ground is no longer bonded to the course below it and every later wind event works on the same spot. Wind also drives debris, and impact damage from a branch or from another roof’s material is a separate mechanism from uplift.
Tropical systems
A tropical system combines two things an ordinary thunderstorm does not: wind that lasts for hours instead of minutes, and rain driven sideways into every seam at the same time. The duration matters because uplift is cumulative — a seal that survives one gust may not survive the same gust repeated for six hours. Wind-driven rain also finds its way through vents, ridge products, flashings and wall-to-roof transitions that shed ordinary vertical rain without difficulty. Inland states see the same mechanism at reduced strength when a system tracks in from the coast.
Ice storms
An ice storm coats a roof, and everything above it, in accreted ice. The weight on the roof itself is one part of it; the larger roofing consequence is usually what the same ice does to trees and limbs overhead, which then come down onto the covering. Ice accretion also works into any existing gap — a lifted shingle, an open seam, a tired flashing — and freeze-thaw cycling widens what it gets into.
Snow load and winter storms
Winter loads a roof rather than striking it. Accumulated snow is a sustained weight on the structure, and drifting means the load is rarely spread evenly — it piles against ridges, dormers, valleys and the low side of any change in roof height. Melt-and-refreeze adds the second mechanism: heat escaping through the roof melts snow that then refreezes at the cold eave, and the resulting ice can back water up under the covering, which sheds water flowing downhill but not water standing still.
Why the storm date matters
Property insurance works from a date of loss — a specific storm on a specific day over a specific area, not a general observation that a roof looks worn. That is why the county list and the effective and expiry times on each alert above are the useful part of this page: they are the National Weather Service’s own record that a given event covered a given county at a given time.
It also matters because hail damage is frequently latent. A fractured shingle mat can take a long time to become a leak, so the gap between the storm and the discovery can be considerable — and by then, establishing which storm did it is a records question rather than an observation. An alert naming a county is not evidence that any particular building was damaged; it is evidence of what the weather was doing over that county, which is where an assessment starts rather than where it ends.
Next steps in New Jersey
Source: the National Weather Service. Every alert on this page comes from the NWS public alerts feed at api.weather.gov, a free US Government service, and is reproduced as the issuing office wrote it. The office that issued each alert is named on the alert itself.
This site does not edit, summarise or re-grade Weather Service text. Alerts are filtered into two separate lists — the event types that affect roofs, and the smoke, fire and airborne-particulate family — and each list is sorted. Nothing else is changed, and no alert is moved between the two lists to suit a heading.